Stop validating methods in spreadsheets.

Plan your study, enter results and get a report that connects the data, acceptance limits and statistical method.

Free to use. See example reports.

You know how a method study goes

The validation spreadsheet only one person understands, and they just gave notice.

A shared workflow anyone on your team can pick up.

Guessing how many samples, levels and days are enough.

Each study starts with a bench plan: how many samples, levels, days and replicates to run.

Hunting down CLIA limits and typing them into cells.

Acceptance limits for over 100 analytes are built in, with the regulation cited. Or use your own.

Formatting reports the week before the inspection.

Download a finished PDF with the data, plots, limits and signature lines.
Math you can check

Calculations are checked against independently worked answers and published examples. Every result names its method and sources.

See the calculation evidence

Start with your study question

Choose a question to see its study plan and report.

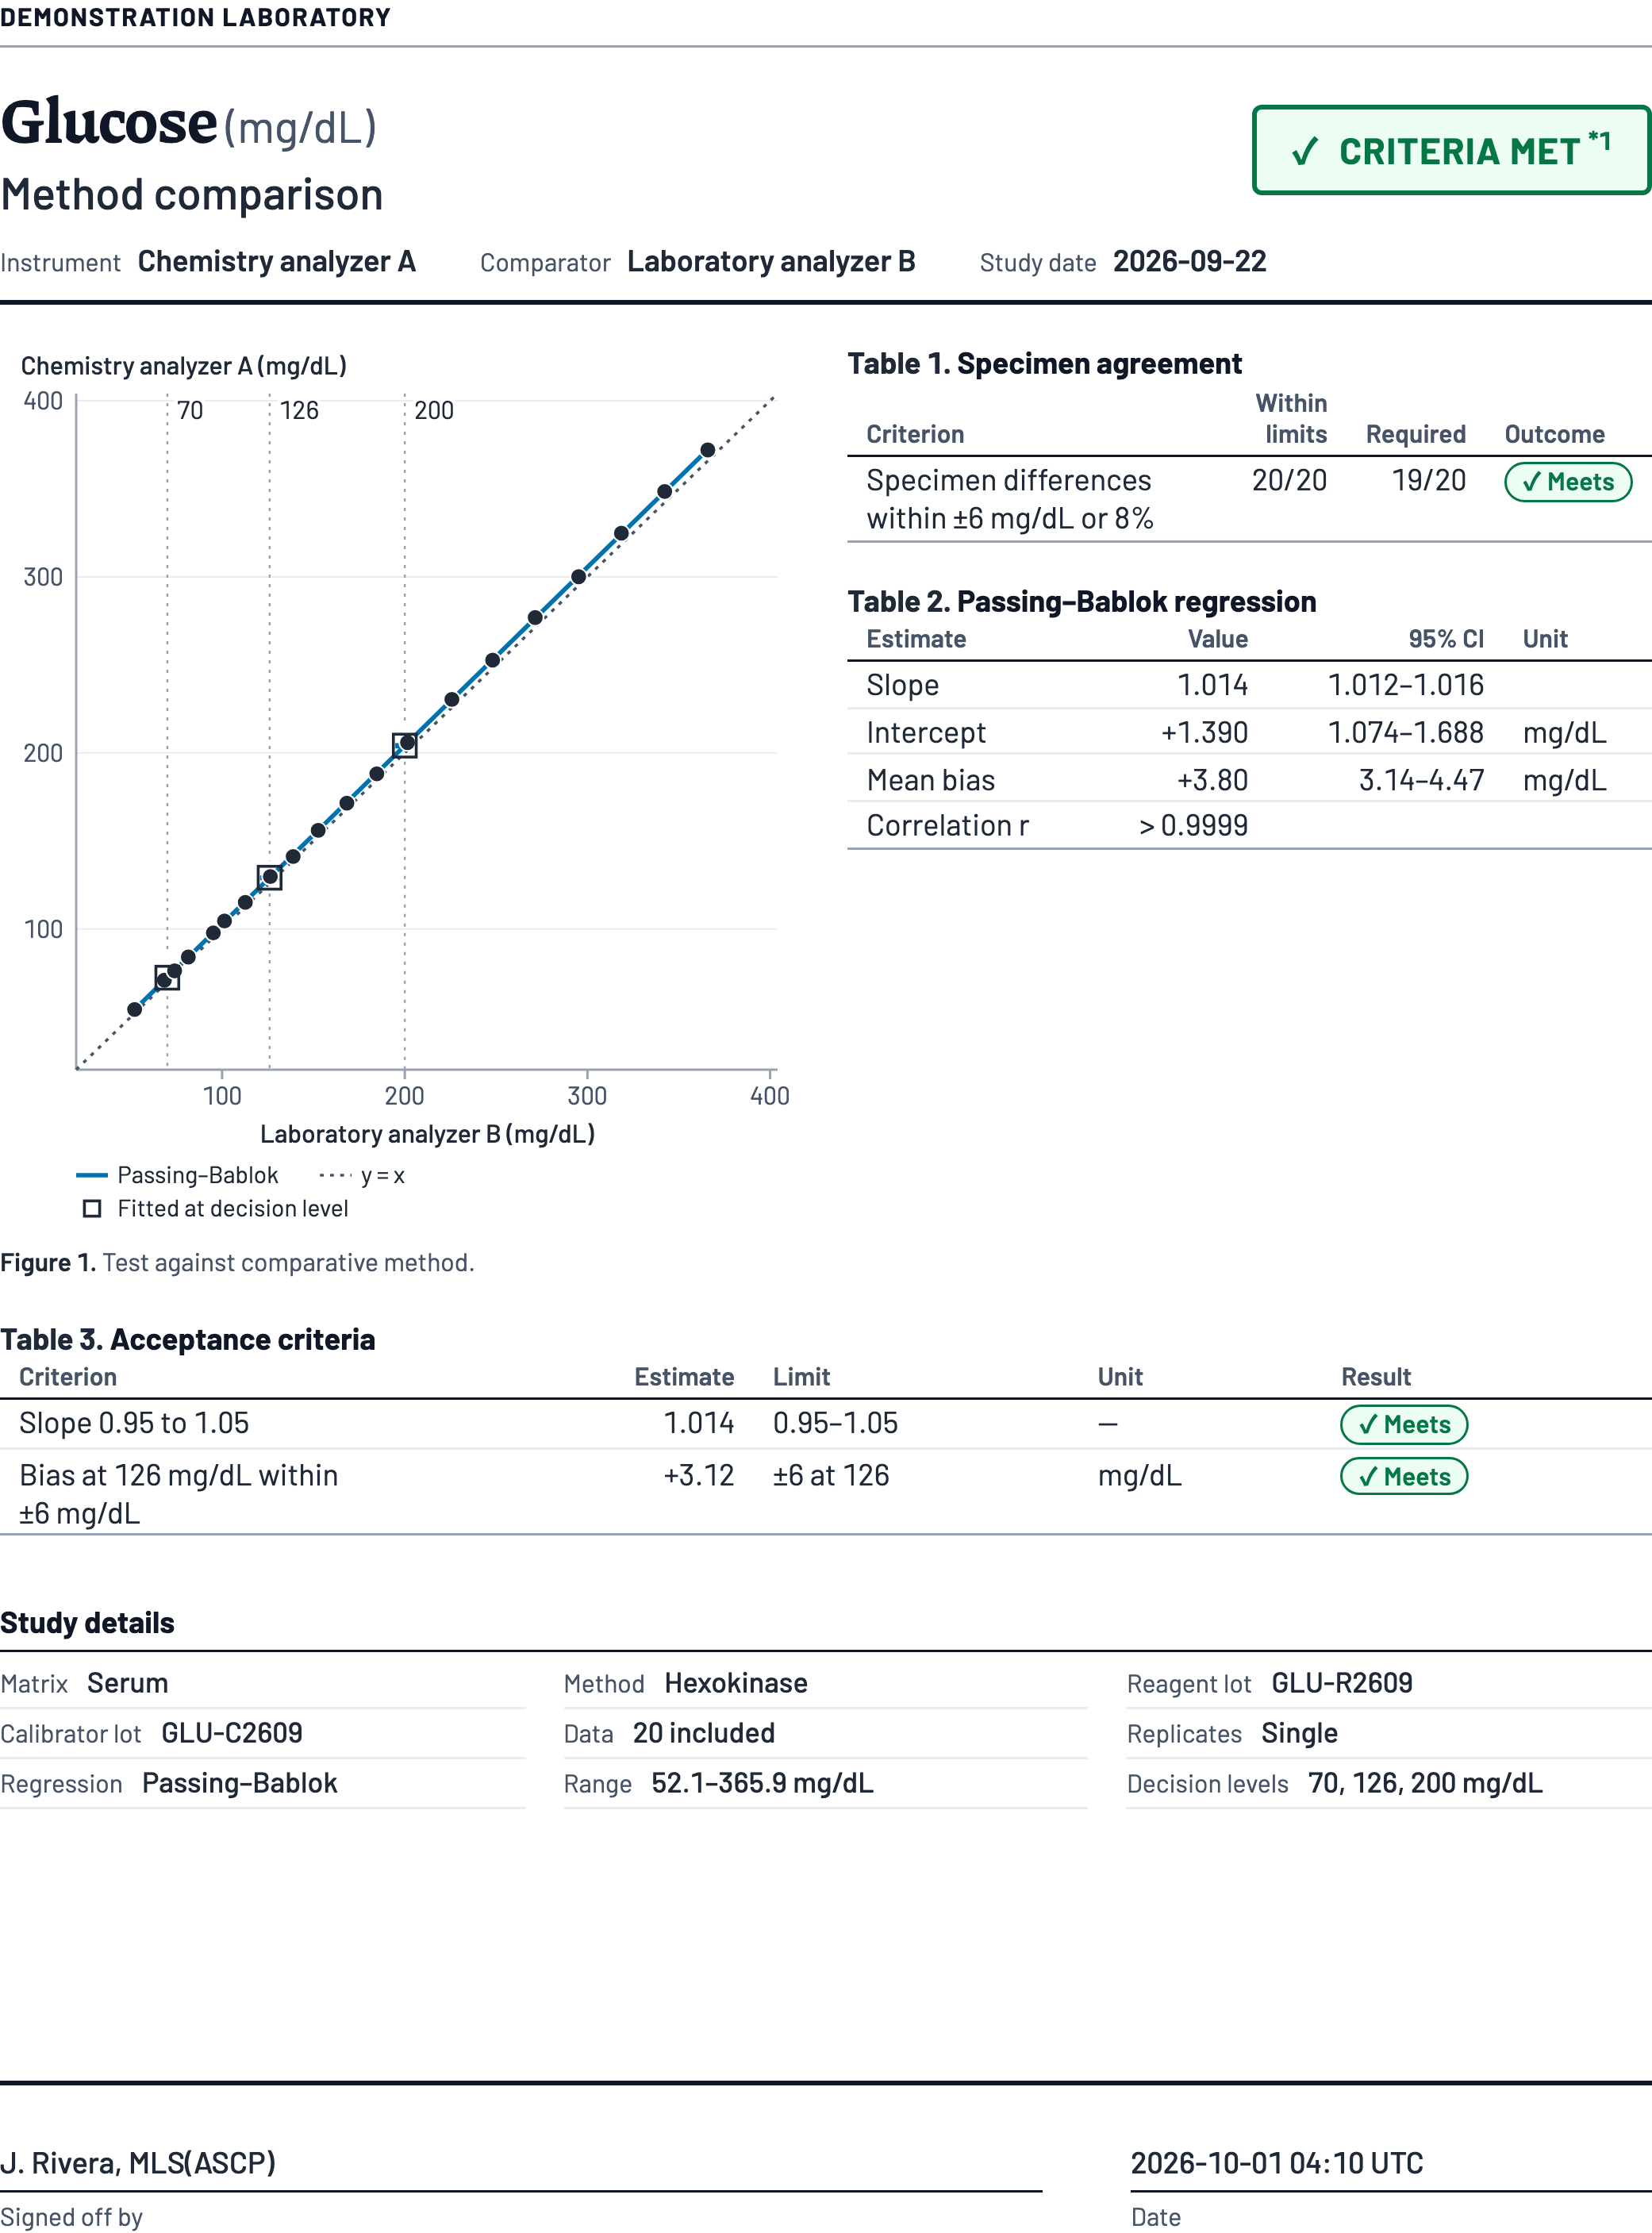
Method comparison

Answers
Does the new method agree with your current method across the reportable range, within your allowable bias?
Suggested plan
40 patient samples across the reporting range, run once on each analyzer: 80 results.
Report shows
A Passing–Bablok, Deming or ordinary regression line, the bias at each medical decision level, and a pass or fail for each limit.
Page 1 of a signed glucose method comparison report: a Passing–Bablok plot, 20 of 20 specimen pairs within the allowable differences of 6 mg/dL or 8%, and criteria met.

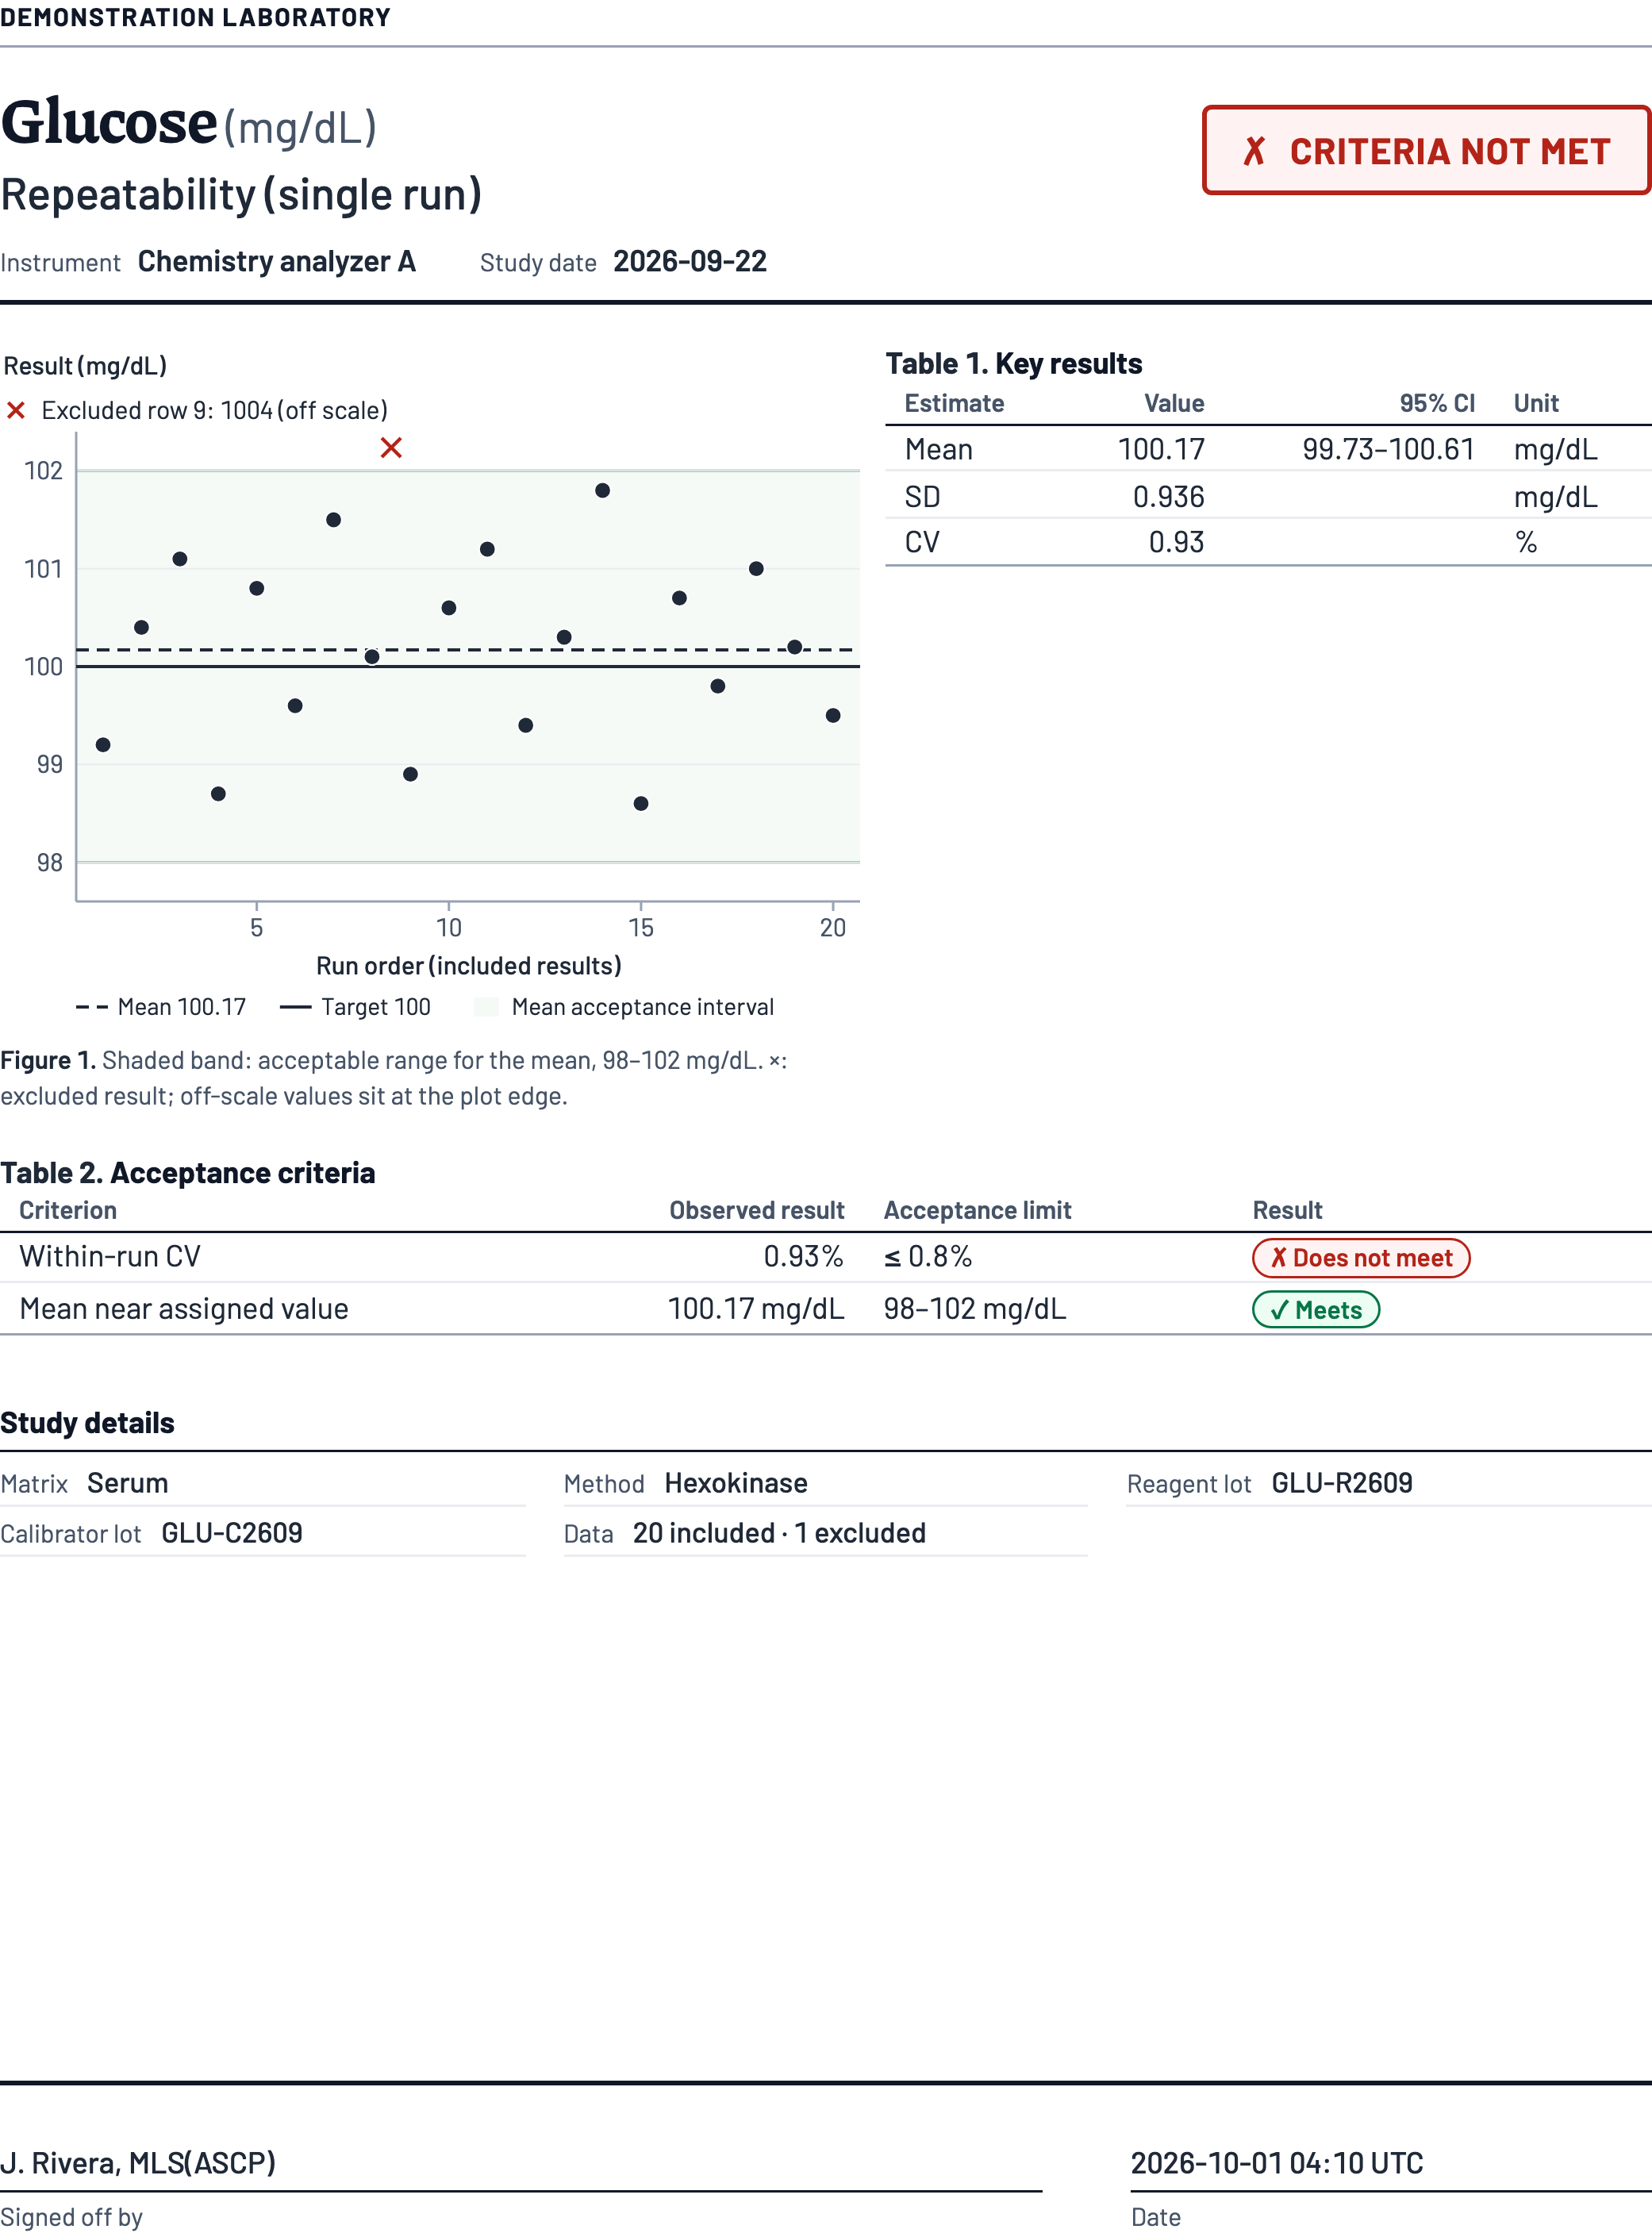
Precision

Answers
How much imprecision does the method show within a run and from day to day, and is it within your limit?
Suggested plan
Two materials, one low and one high, measured 20 times each: 40 results. Multi-day plans are in the guide.
Report shows
SD and CV, the mean with its confidence interval, each excluded result with its reason, and a pass or fail. This example misses its limit.
Page 1 of a signed glucose repeatability report: 20 results used and 1 excluded, CV 0.93% against a limit of 0.8%, criteria not met.

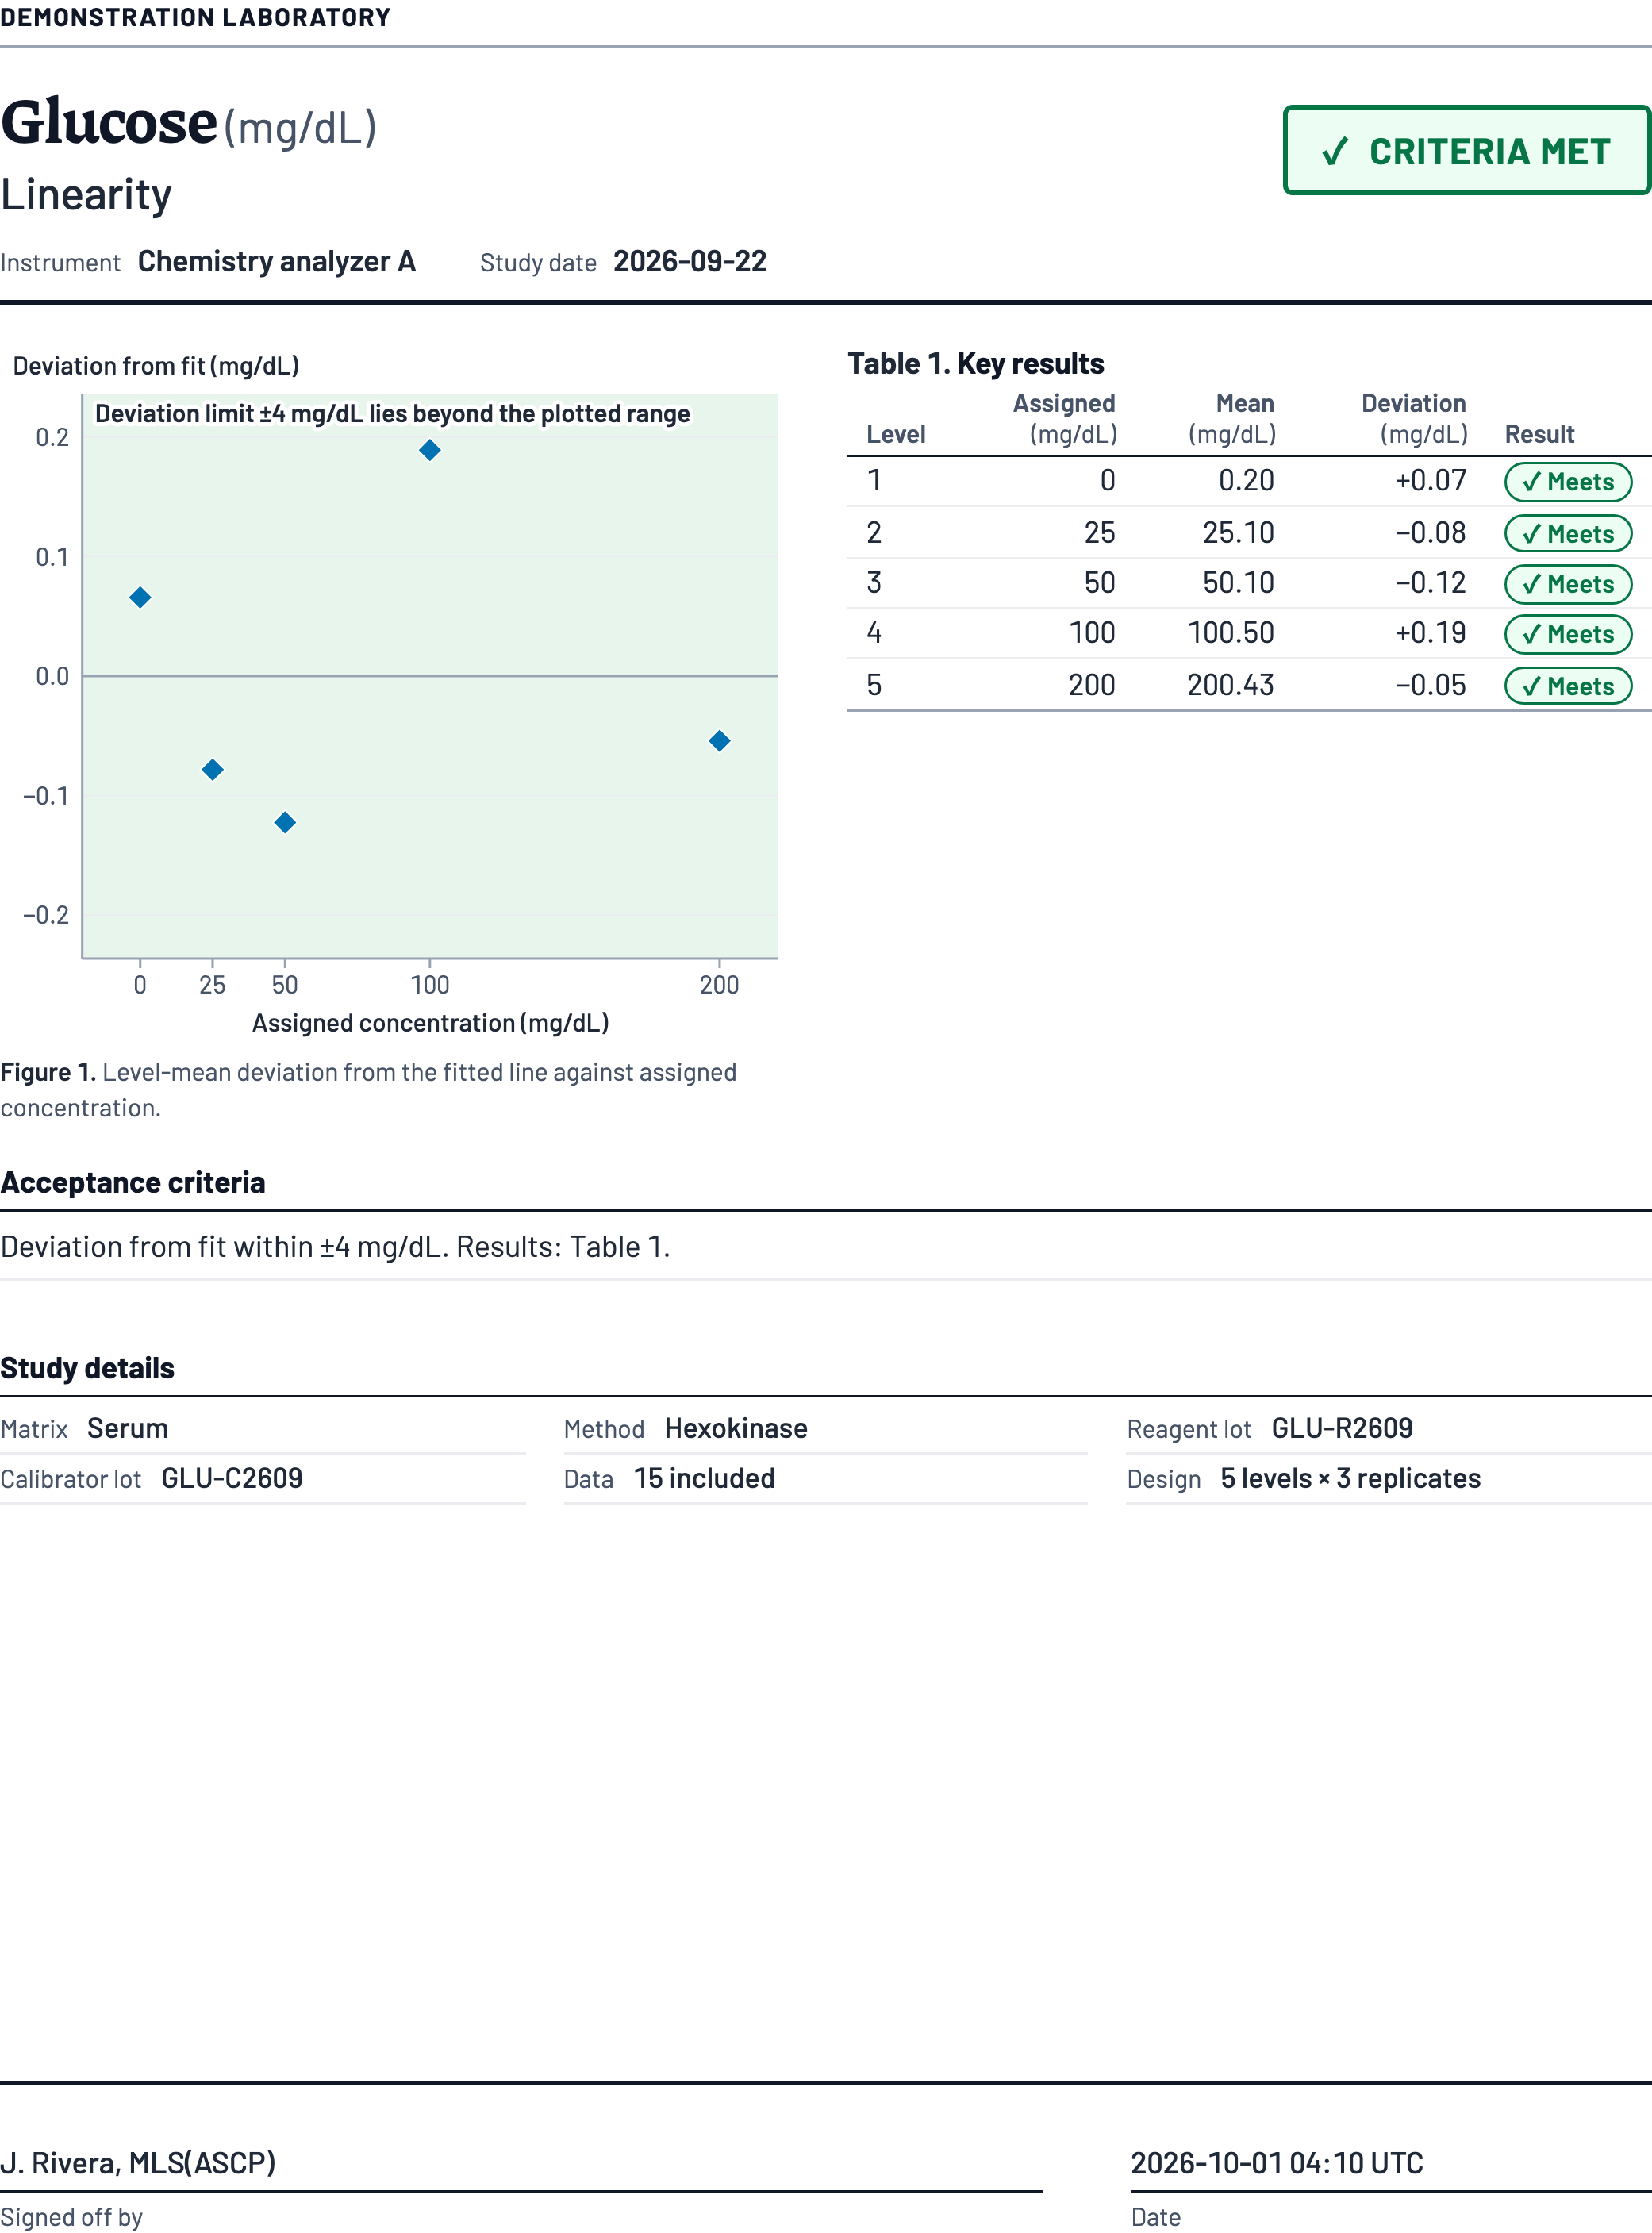
Linearity

Answers
Does the response stay linear from the bottom to the top of the measuring range you intend to report?
Suggested plan
5 known concentrations, measured 3 times each: 15 results.
Report shows
How far each level sits from the fitted line, a pass or fail at every level, and whether levels near each end verify your reportable range.
Page 1 of a signed glucose linearity report: five levels from 0 to 200 mg/dL, each within the 4 mg/dL deviation limit.

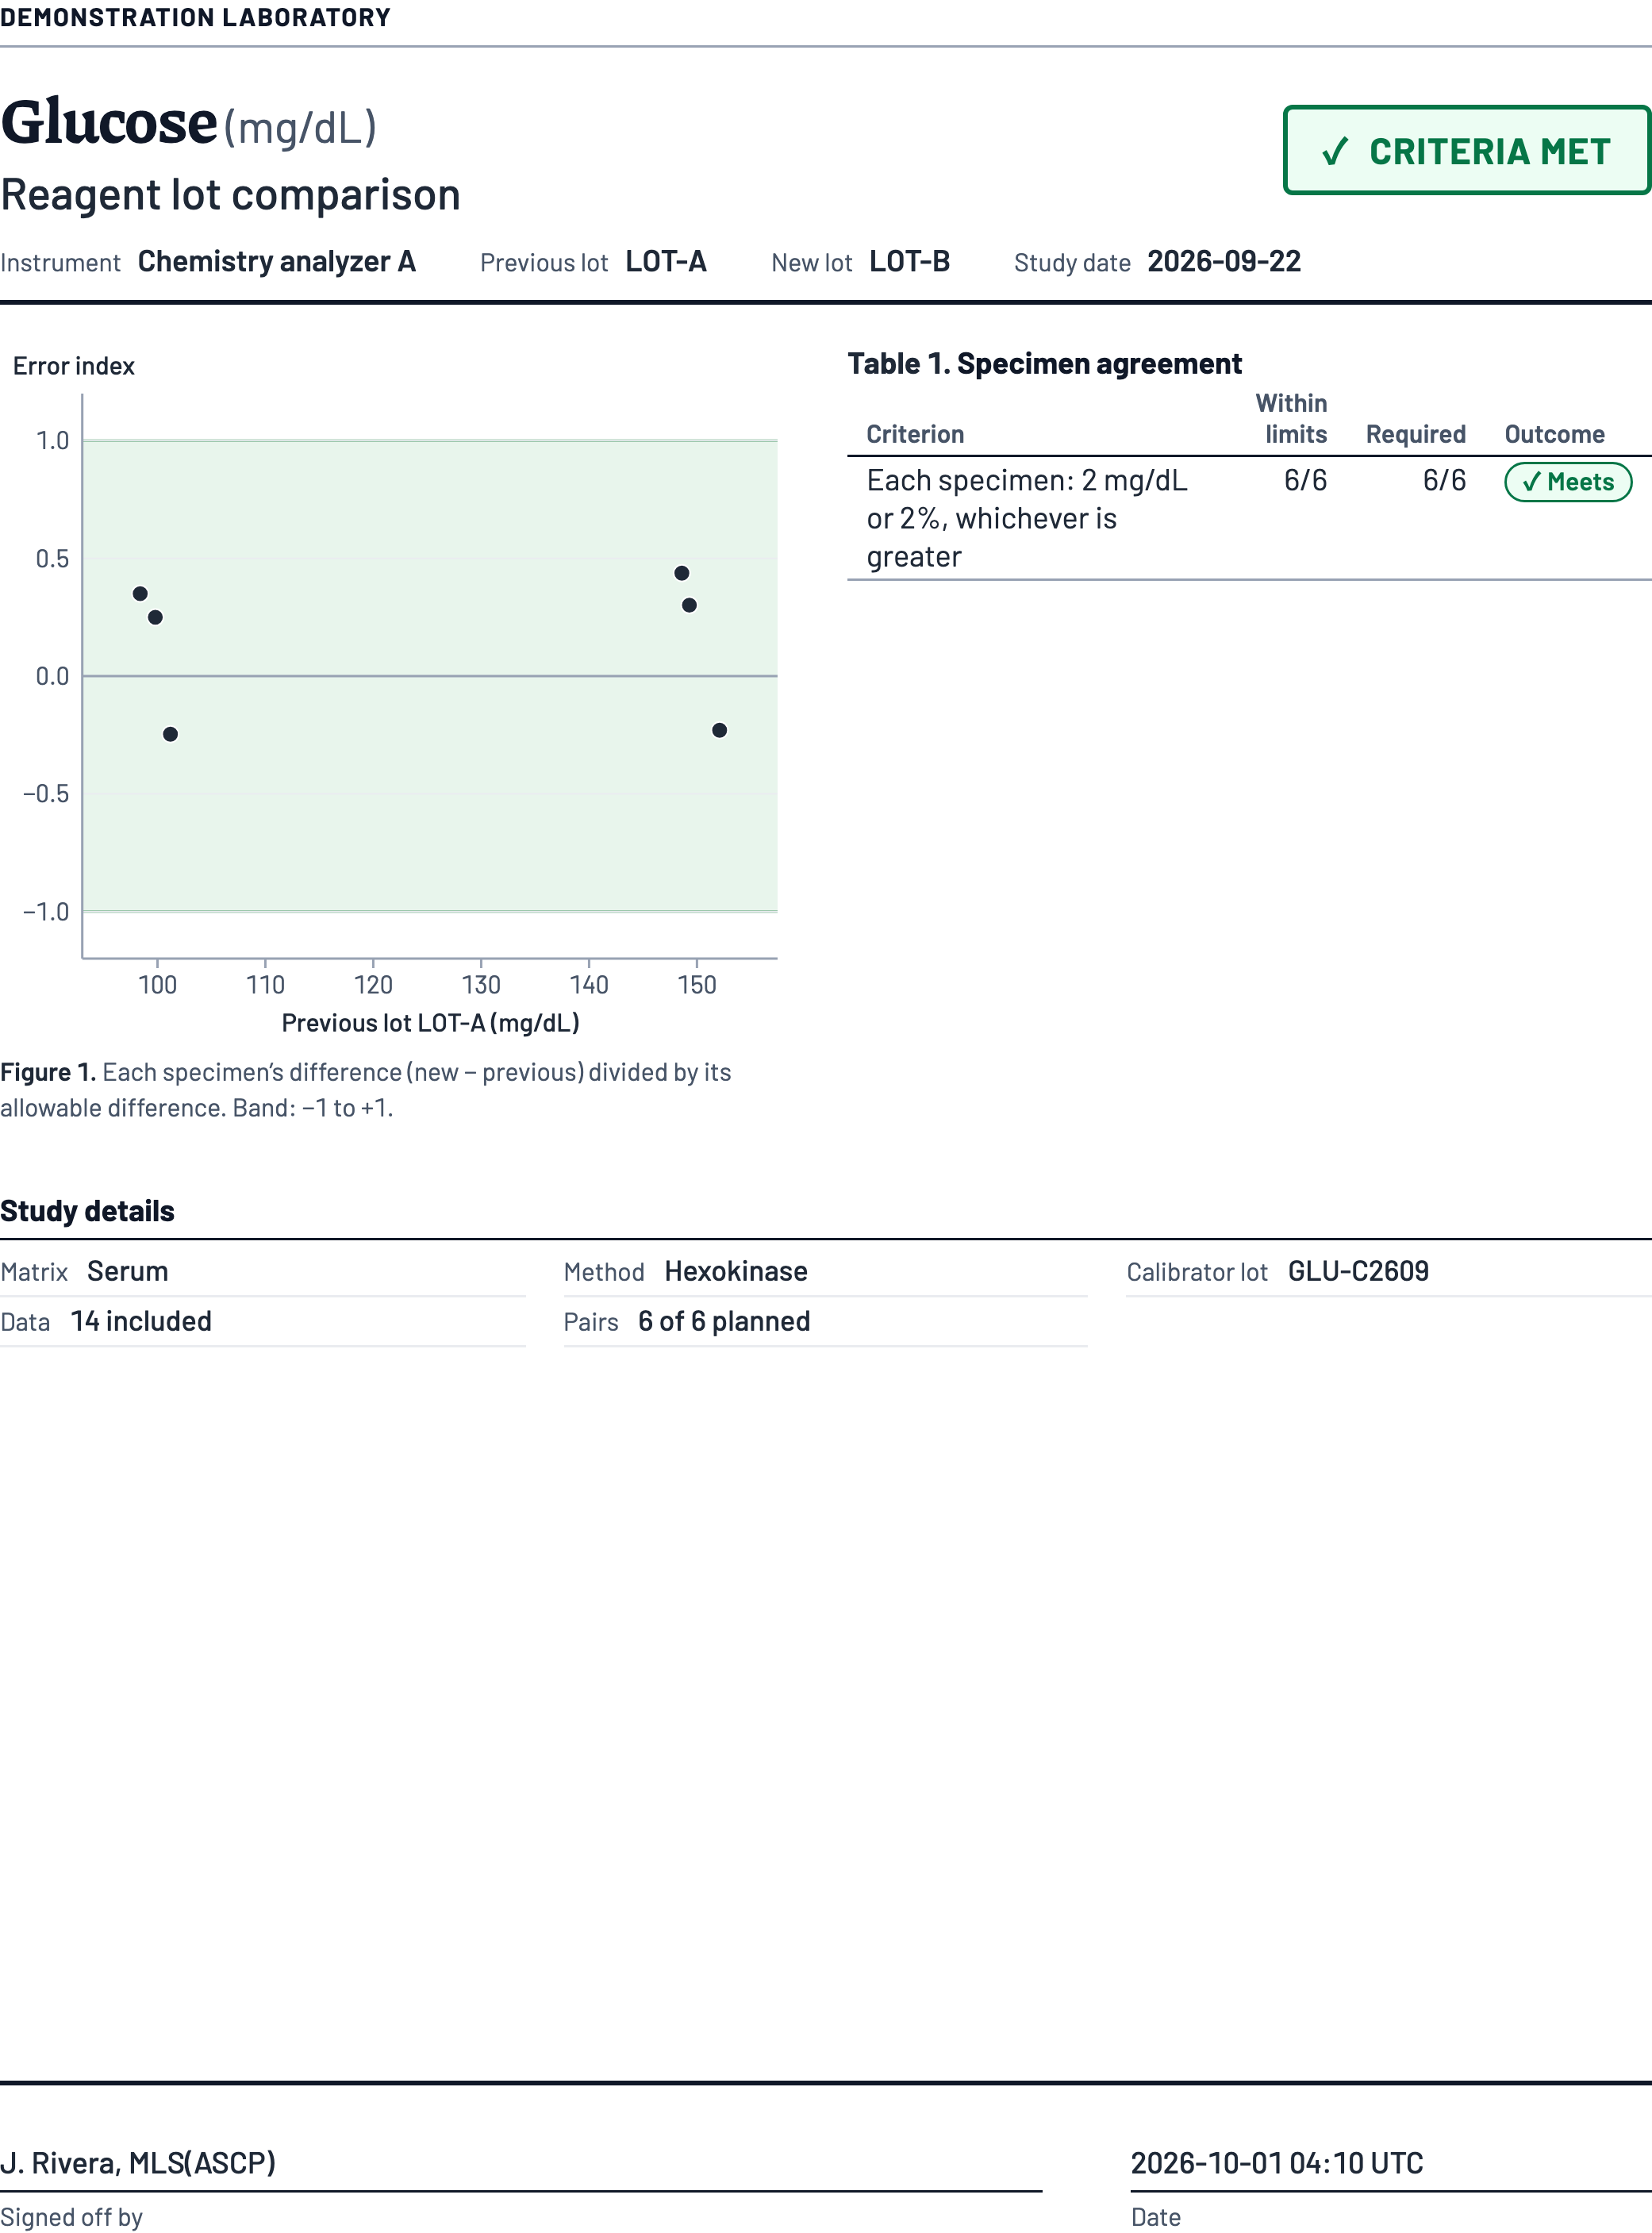
Reagent lot comparison

Answers
Does a new reagent or calibrator lot shift patient results by more than you allow?
Suggested plan
The same patient samples on the current and the new lot, for example 20 in each concentration range.
Report shows
Each patient sample’s difference against your allowable limit, the mean shift with its confidence interval, and reusable plans for lot changes you repeat.
Page 1 of a signed glucose reagent lot comparison: all six specimen pairs within 2 mg/dL or 2%, whichever is greater, and criteria met.
See all supported studies

From study plan to finished report

Your laboratory collects the results, reviews the evidence and makes the decision.

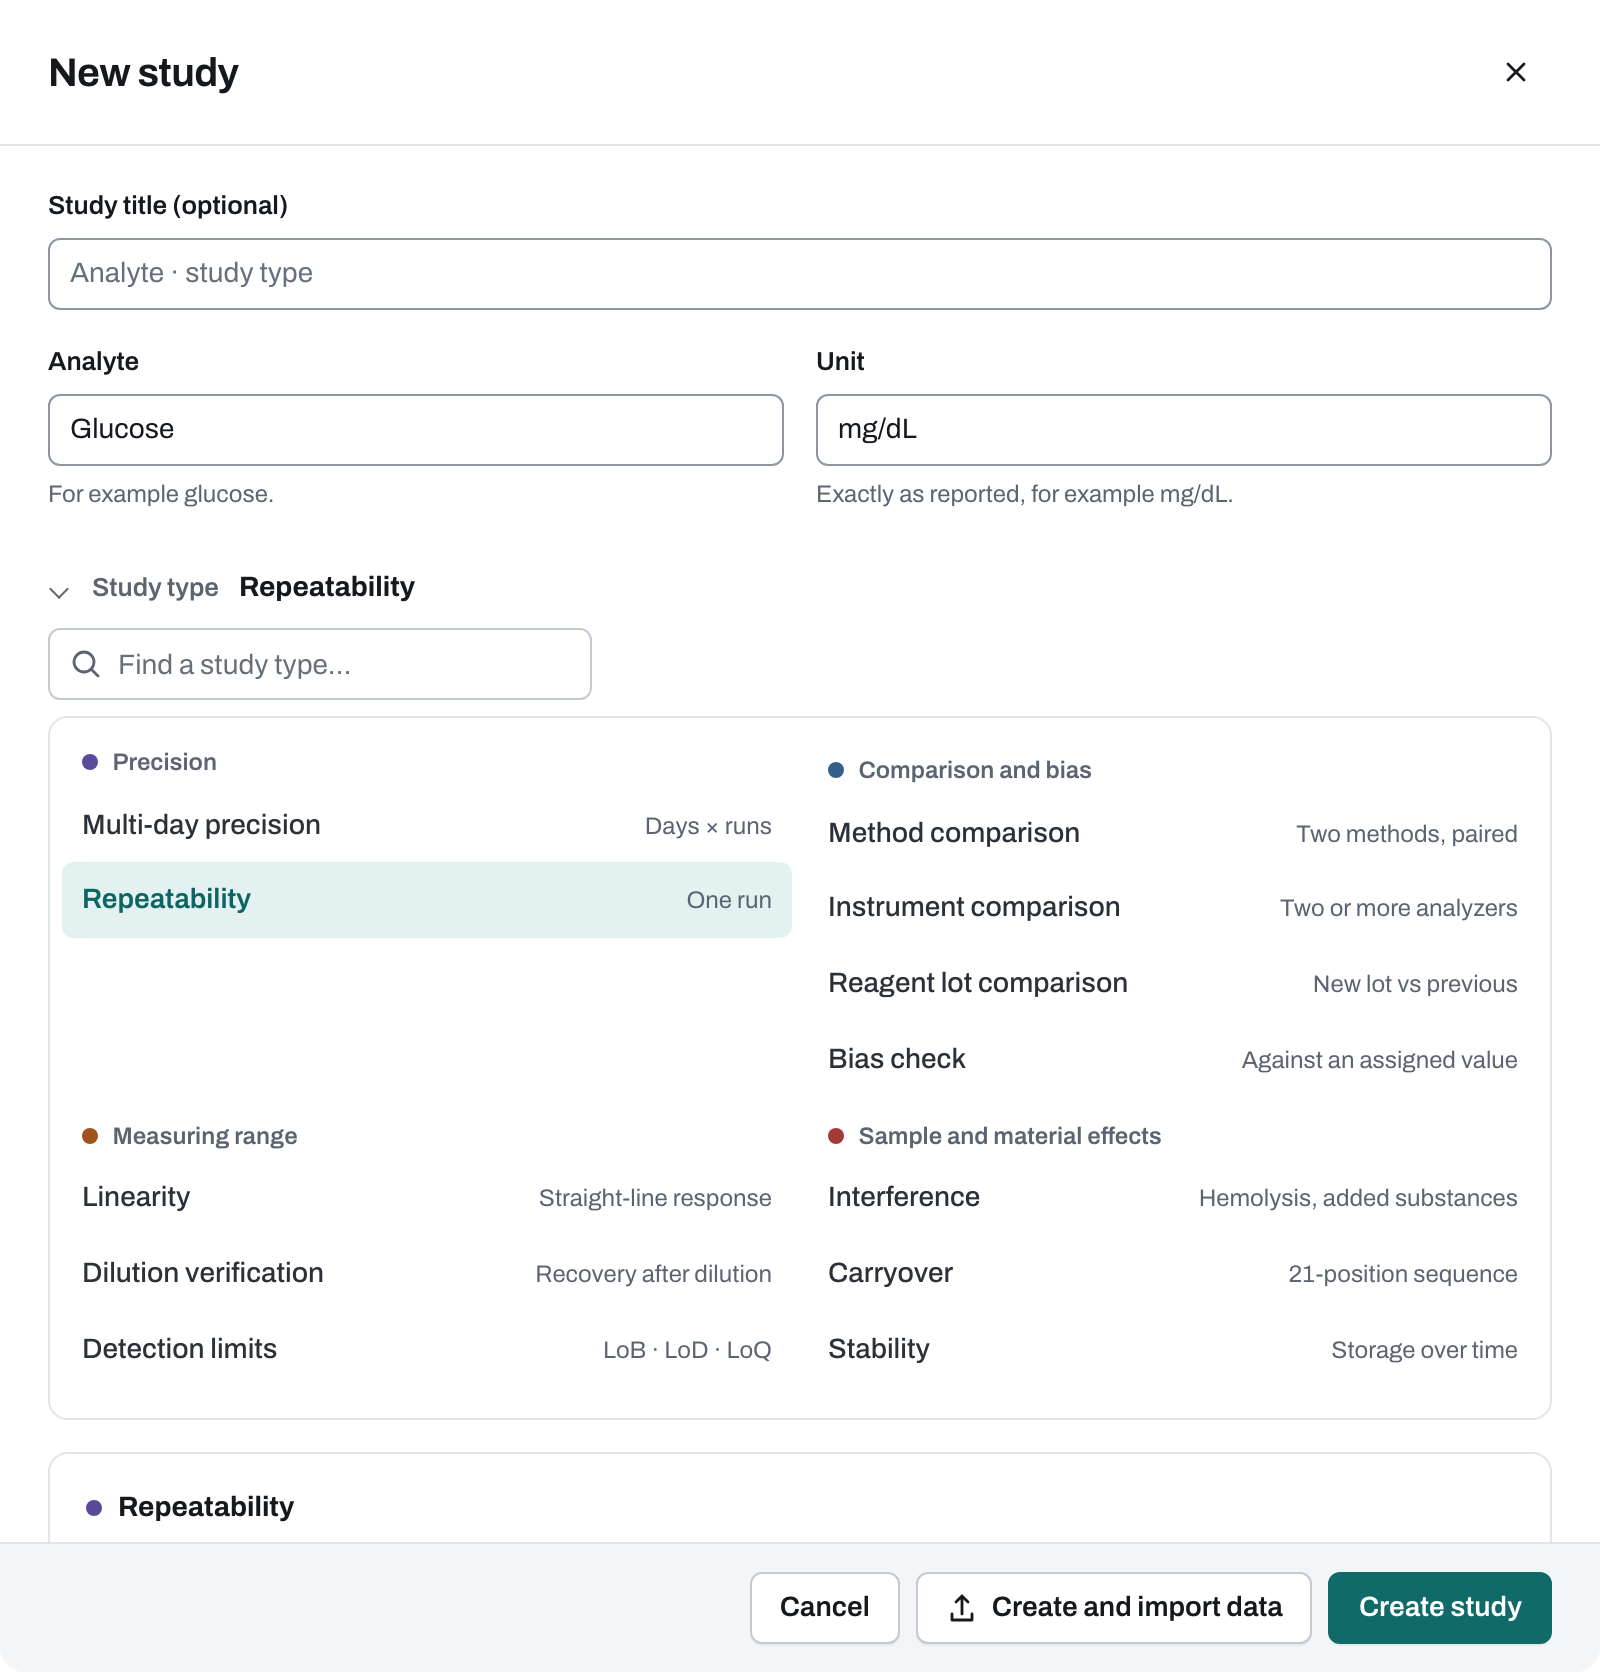
  1. The New study dialog, with studies grouped by the question they answer and Repeatability selected.

    Pick what you need to prove

    Studies are listed by the question they answer, each with a one-page bench plan you can print.

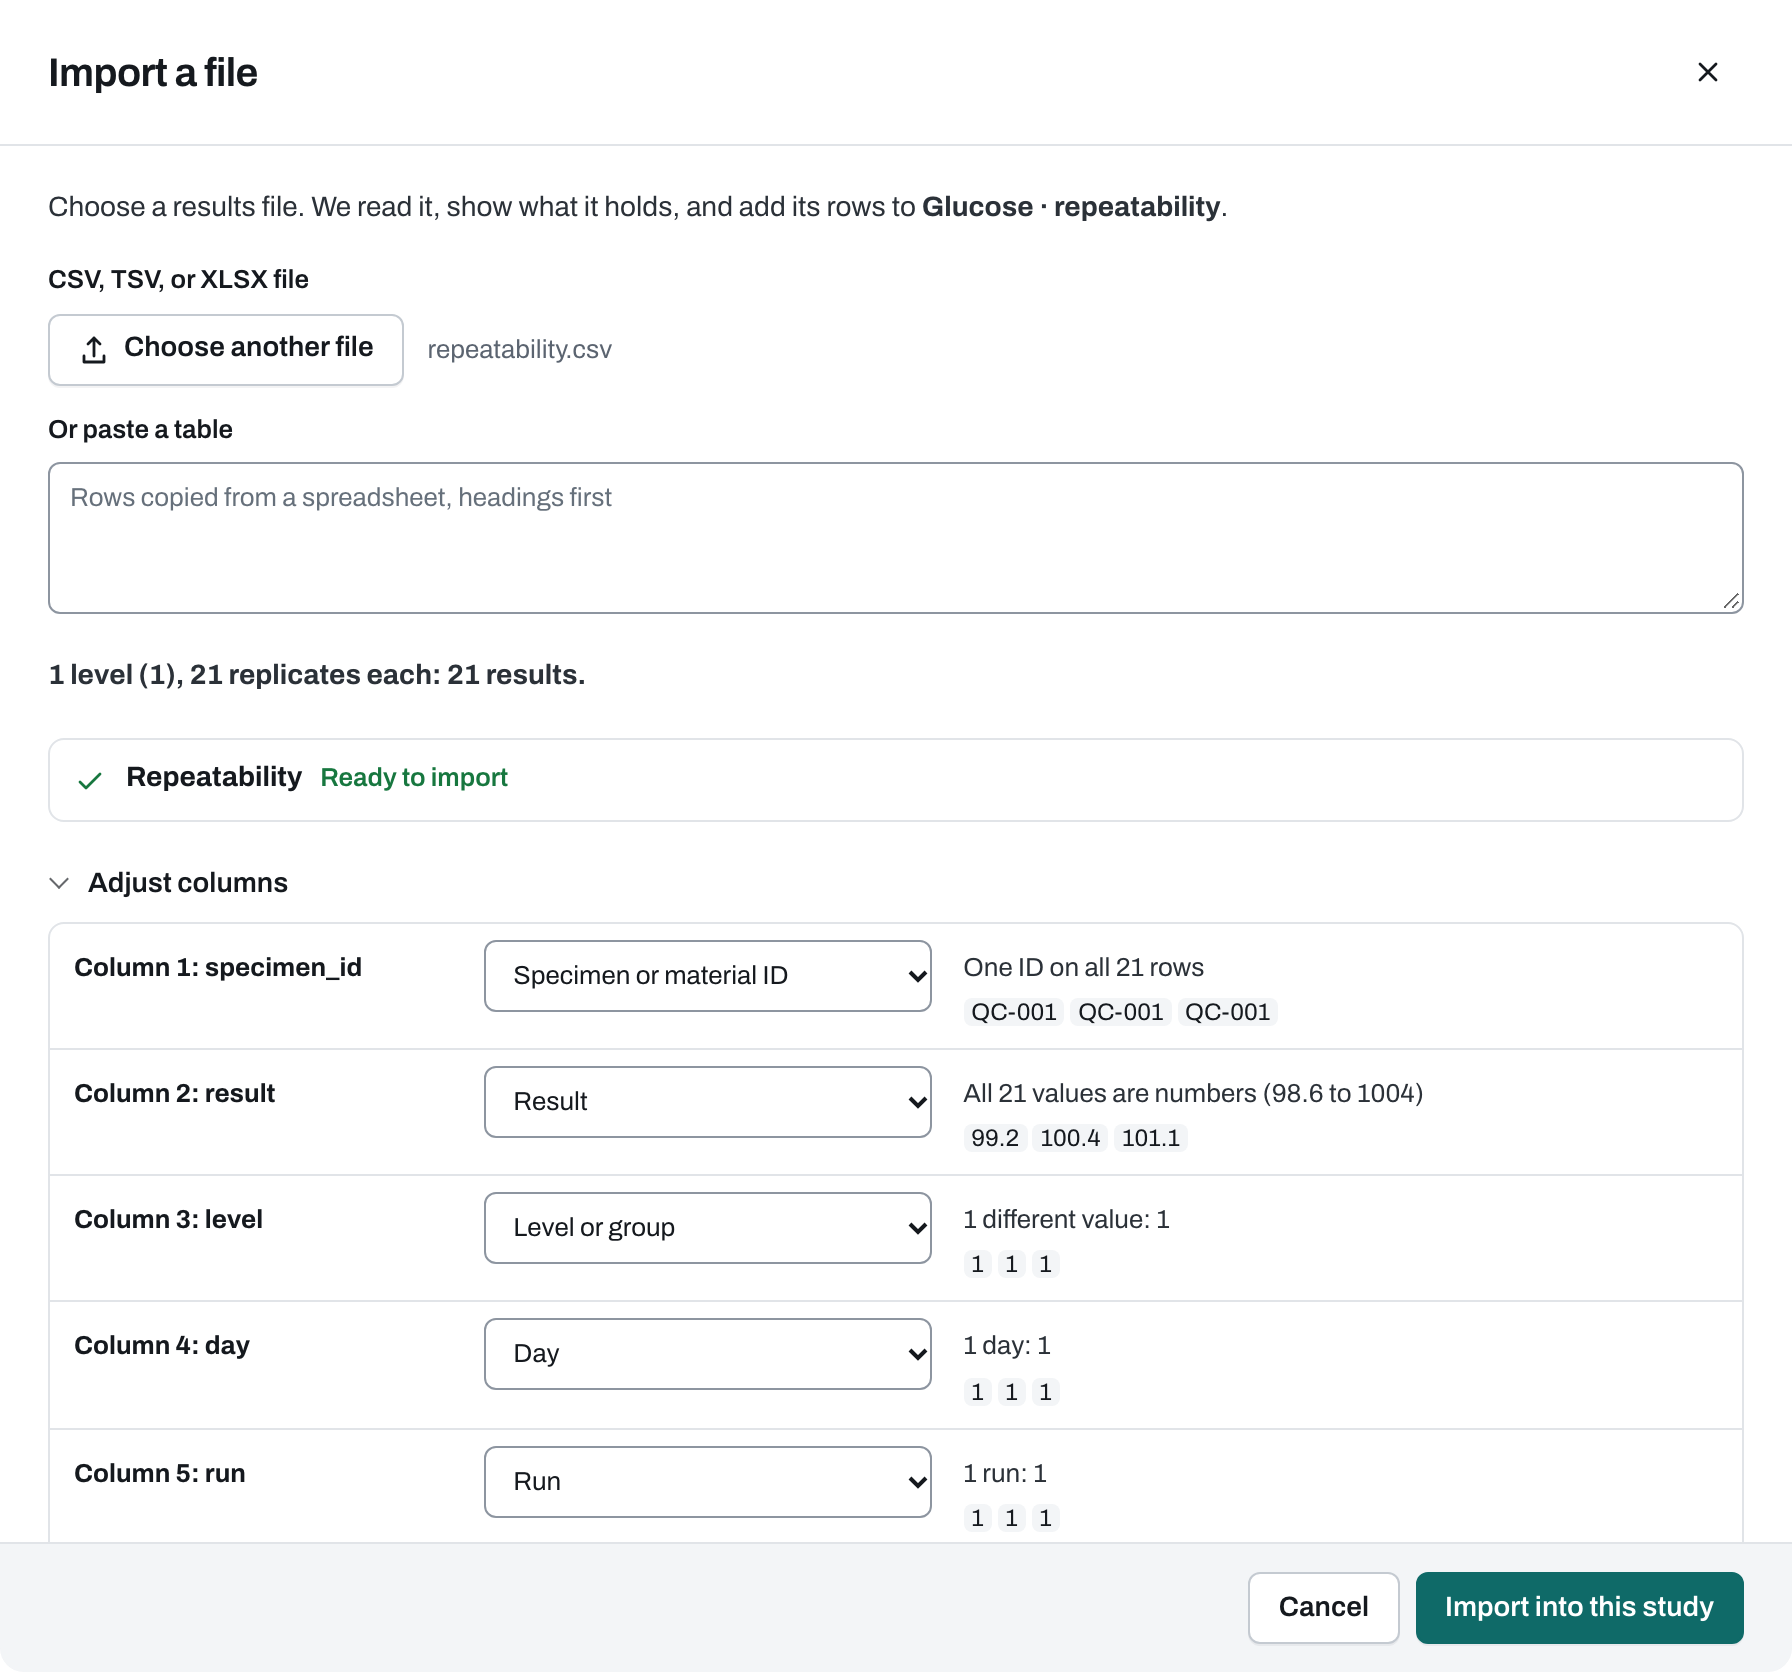
  2. The Import a file dialog, showing the recognized study design and the results ready to import.

    Drop in your results

    Import the instrument export or paste from a spreadsheet. The columns are matched for you.

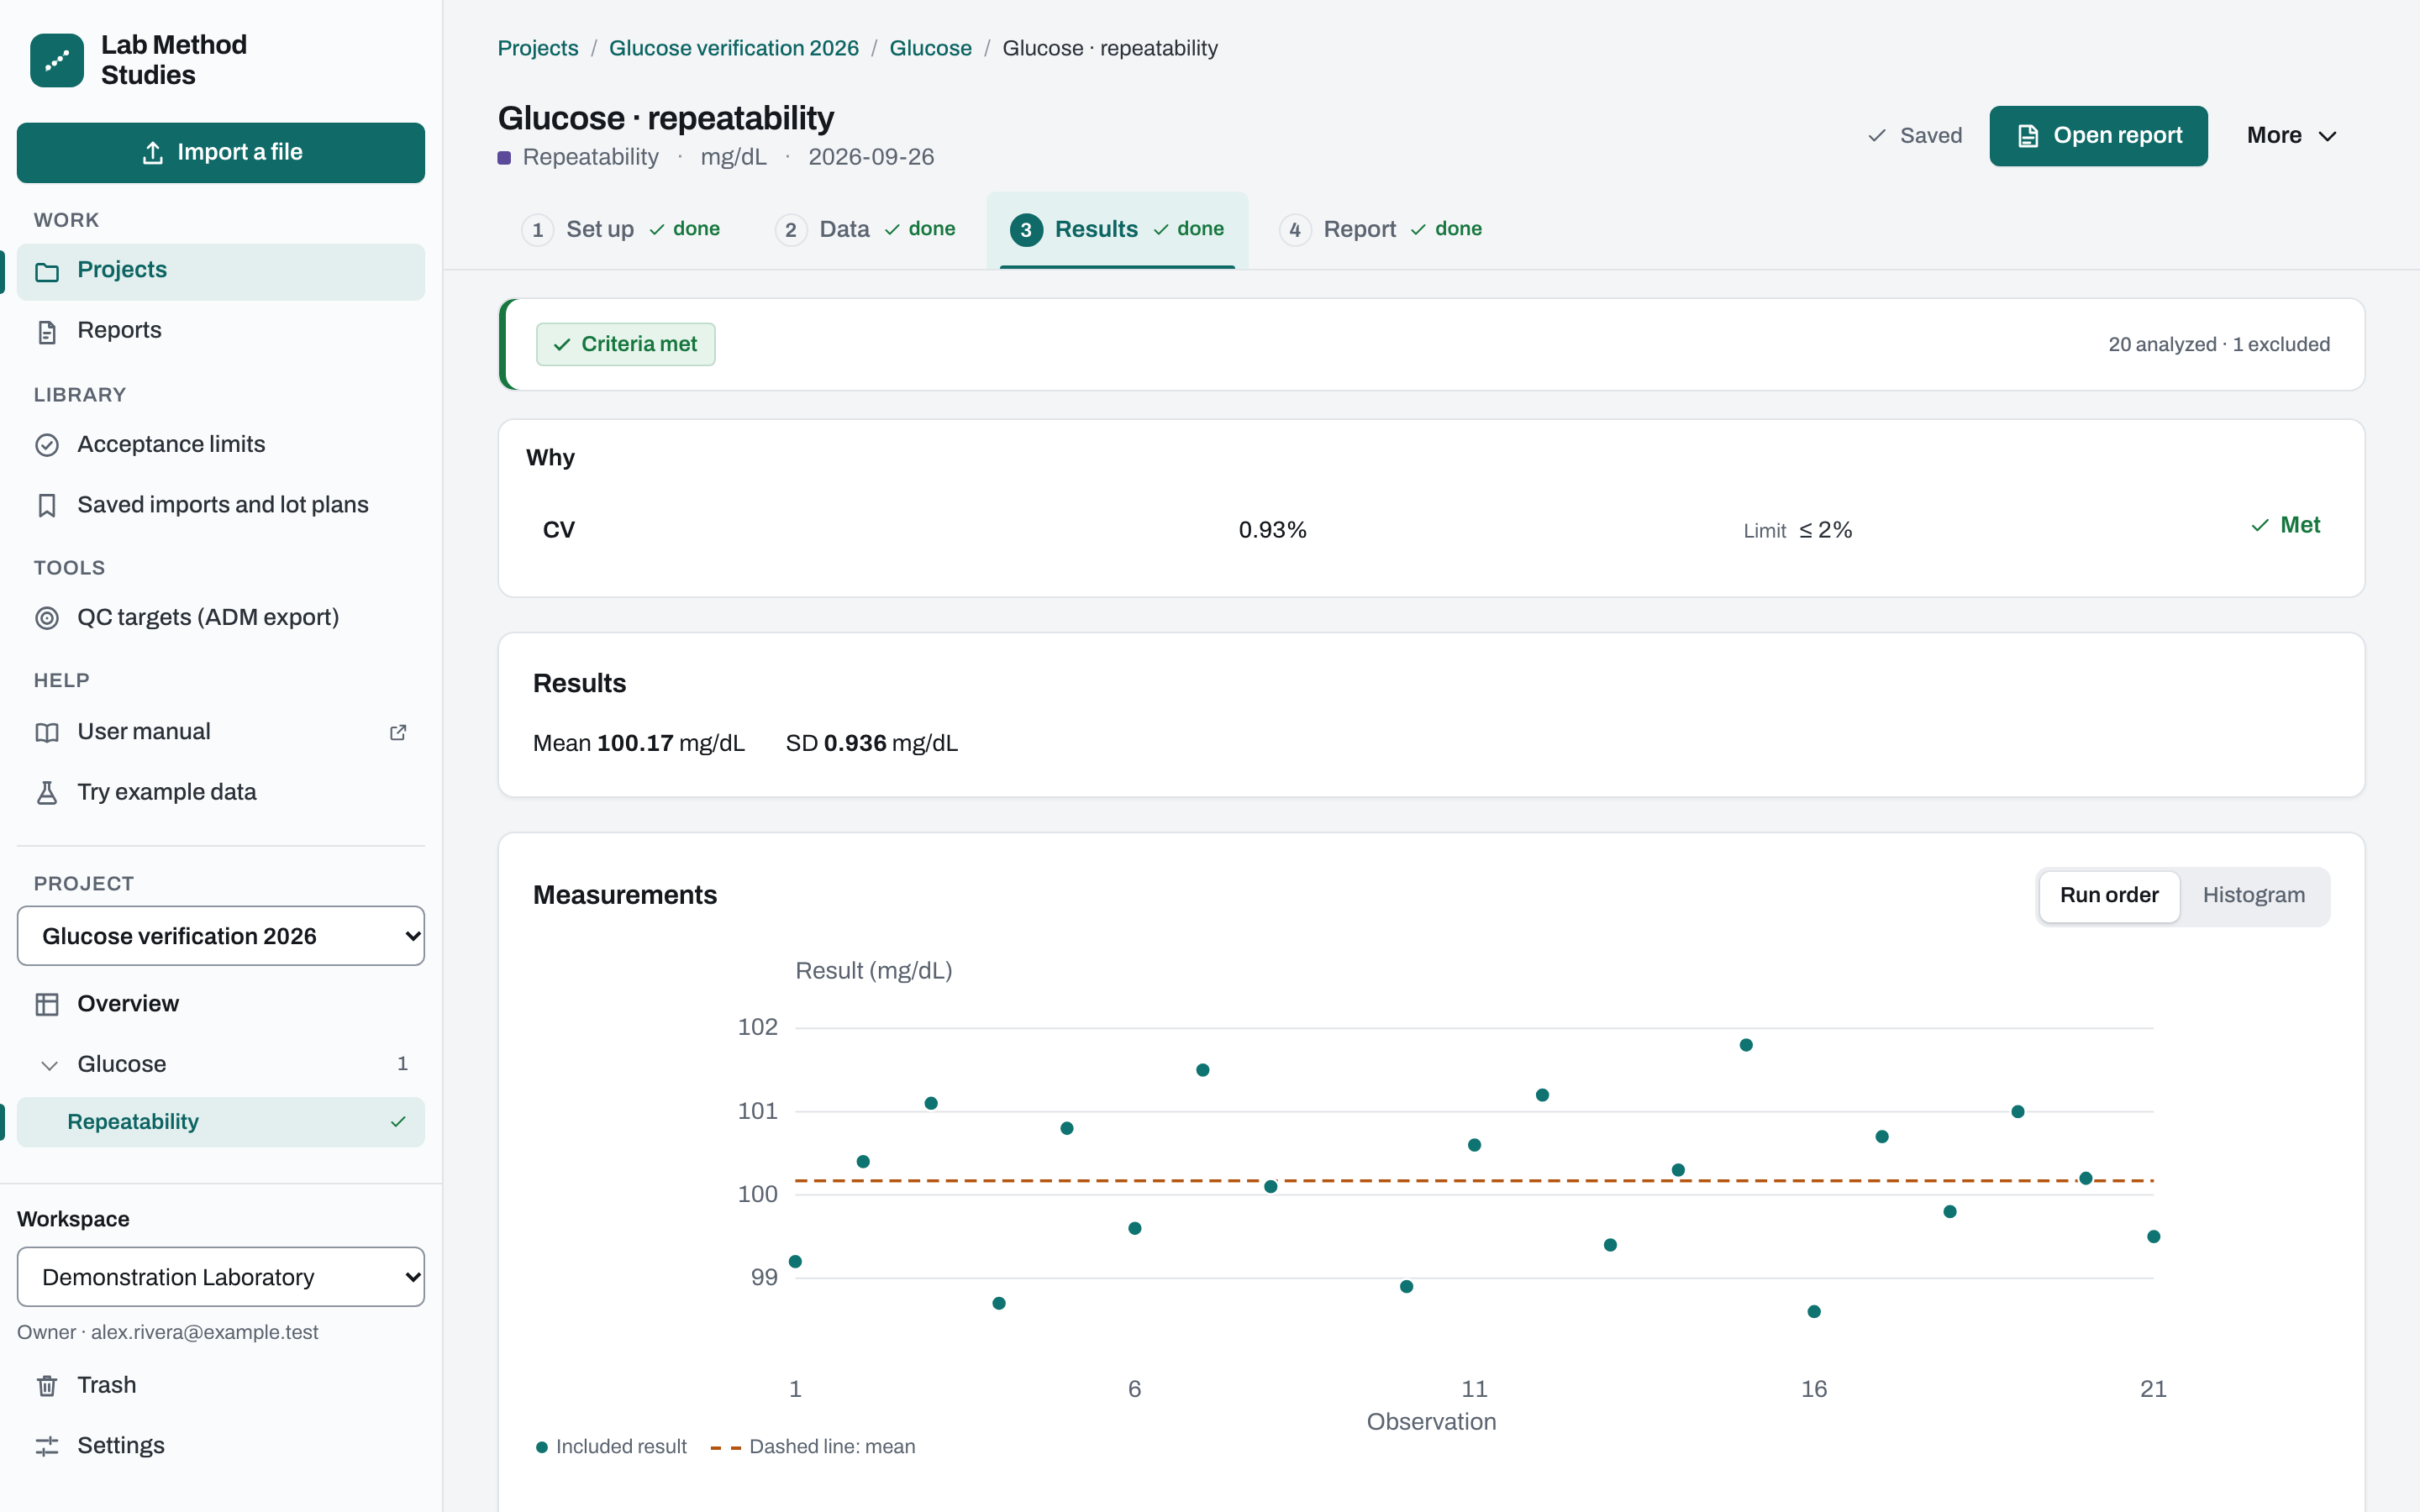
  3. The results screen for a glucose repeatability study, with the acceptance check and a run-order plot.

    See pass or fail

    Each limit is marked met or missed, with the plots. Too little data never counts as a pass.

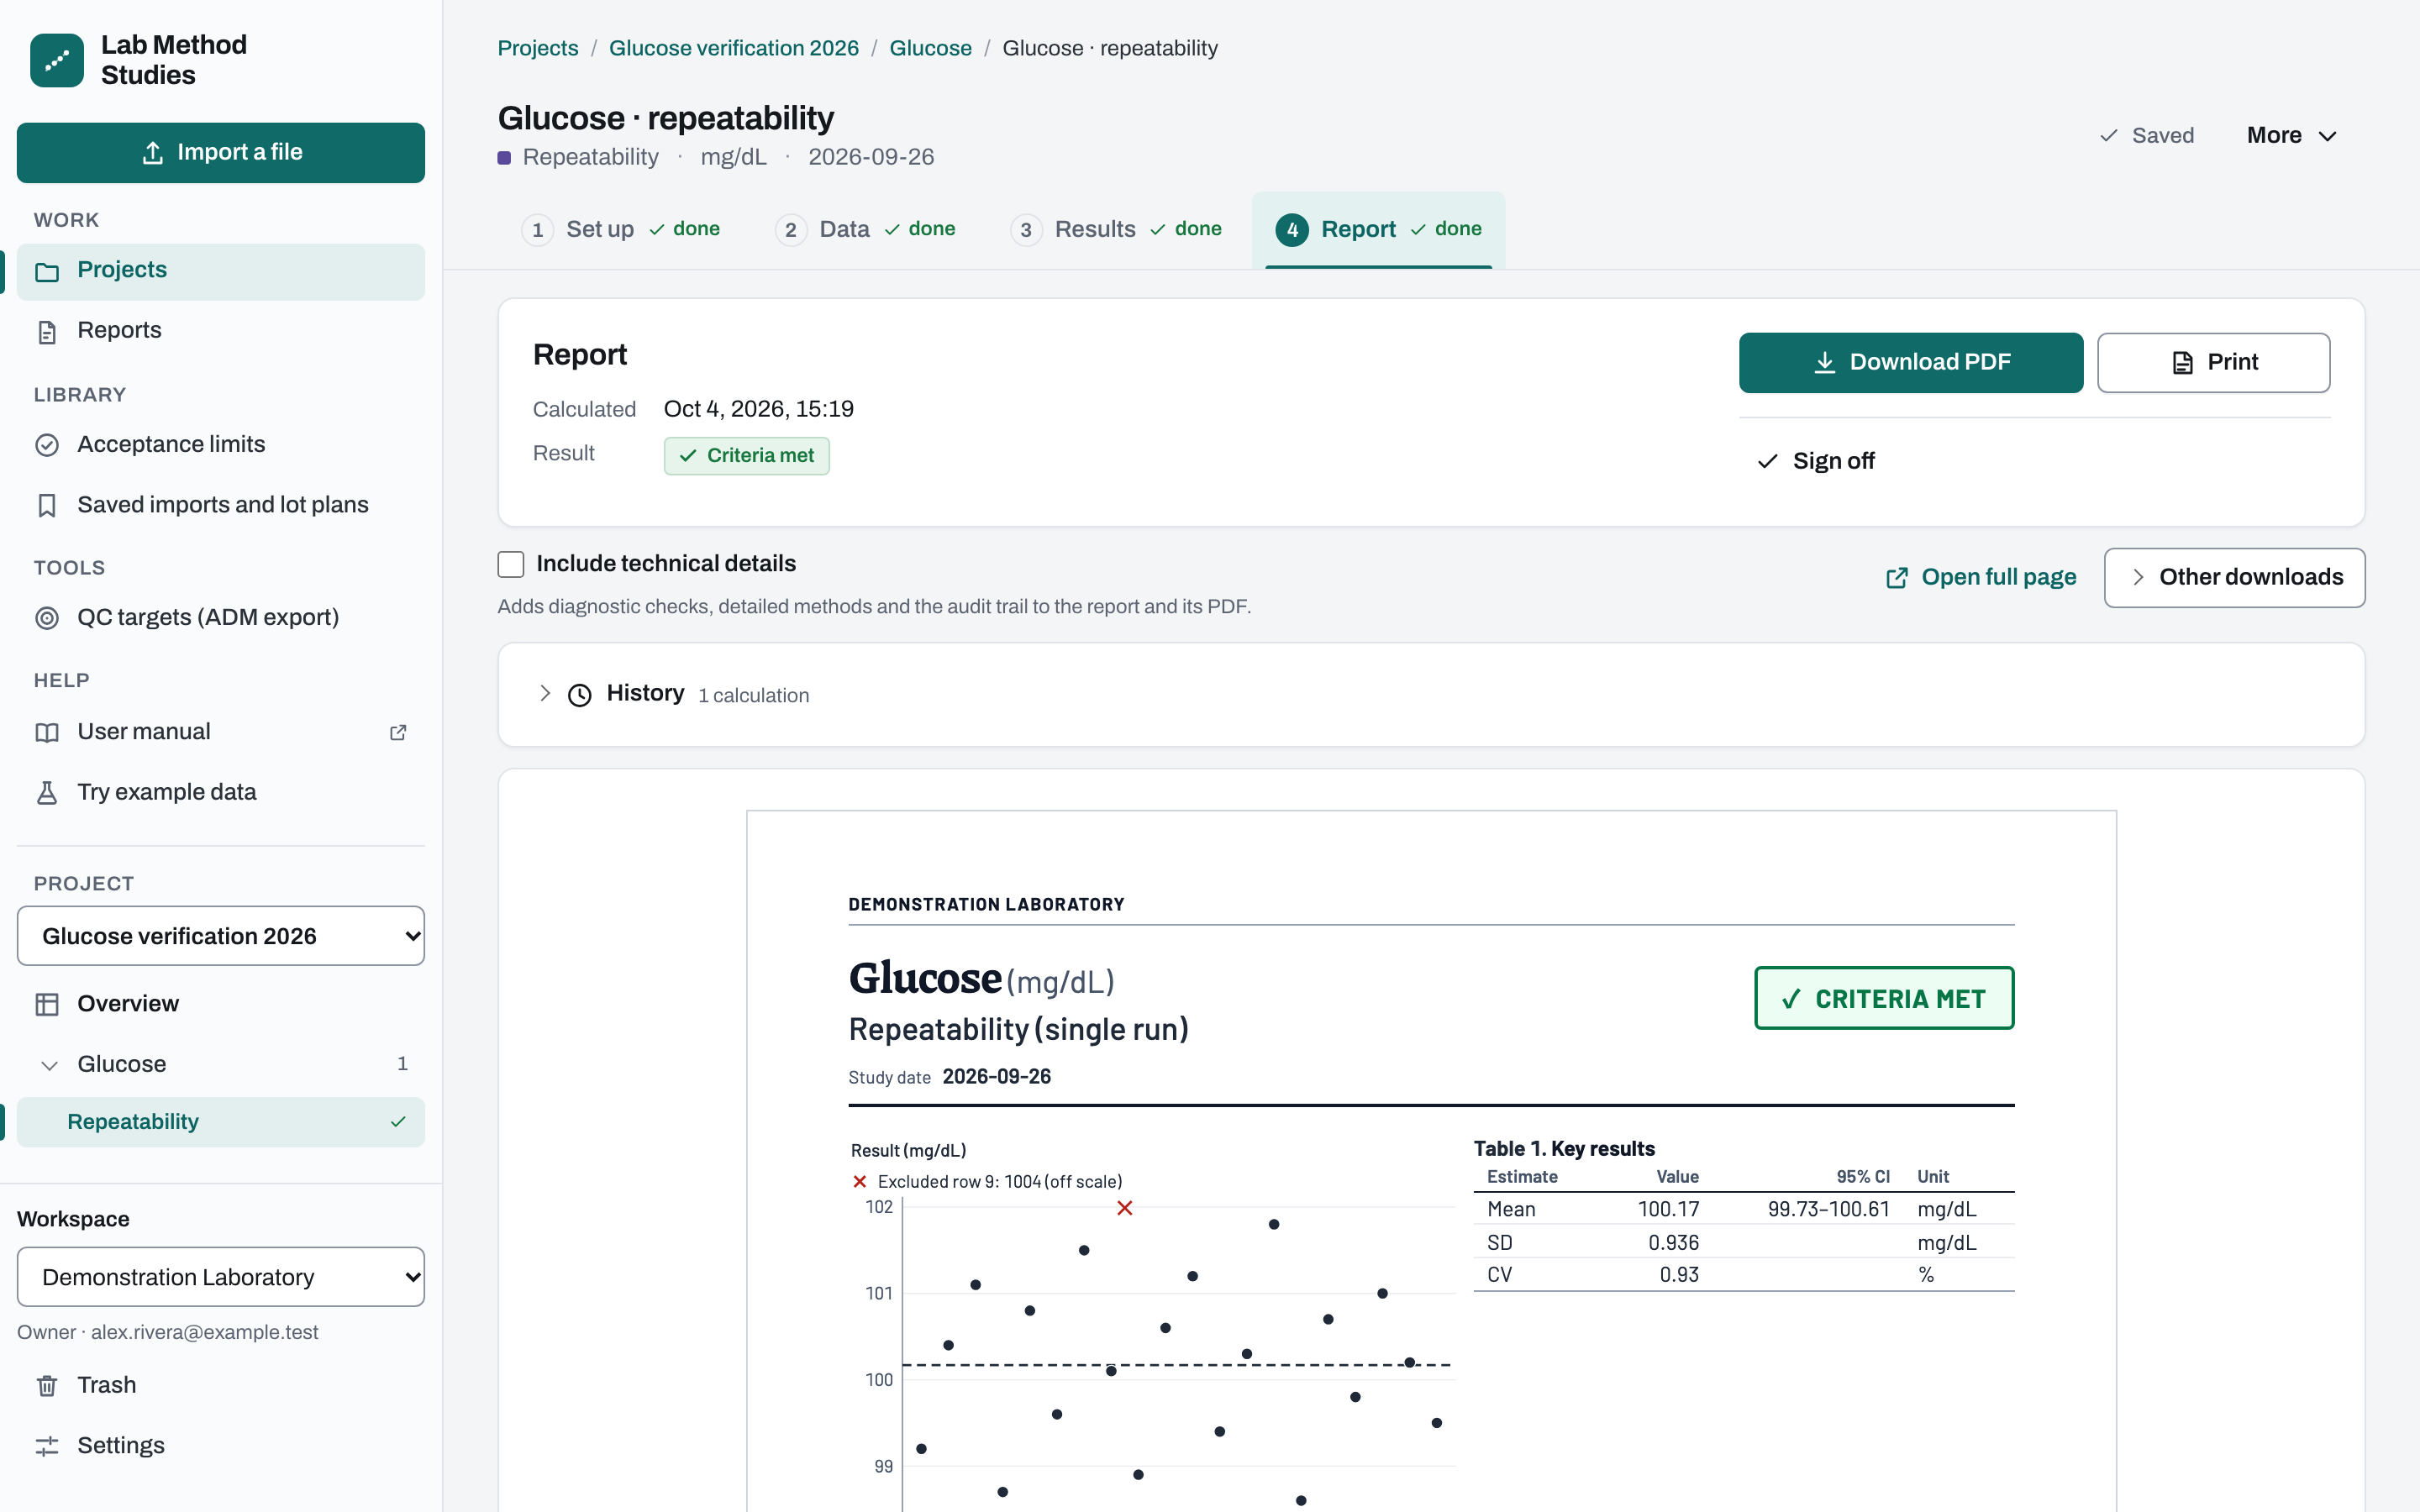
  4. The Report stage, with Download PDF, Print and Sign off above the report.

    Print and file it

    Download or print the PDF, sign it by hand or with Sign off, and file it with your study records.

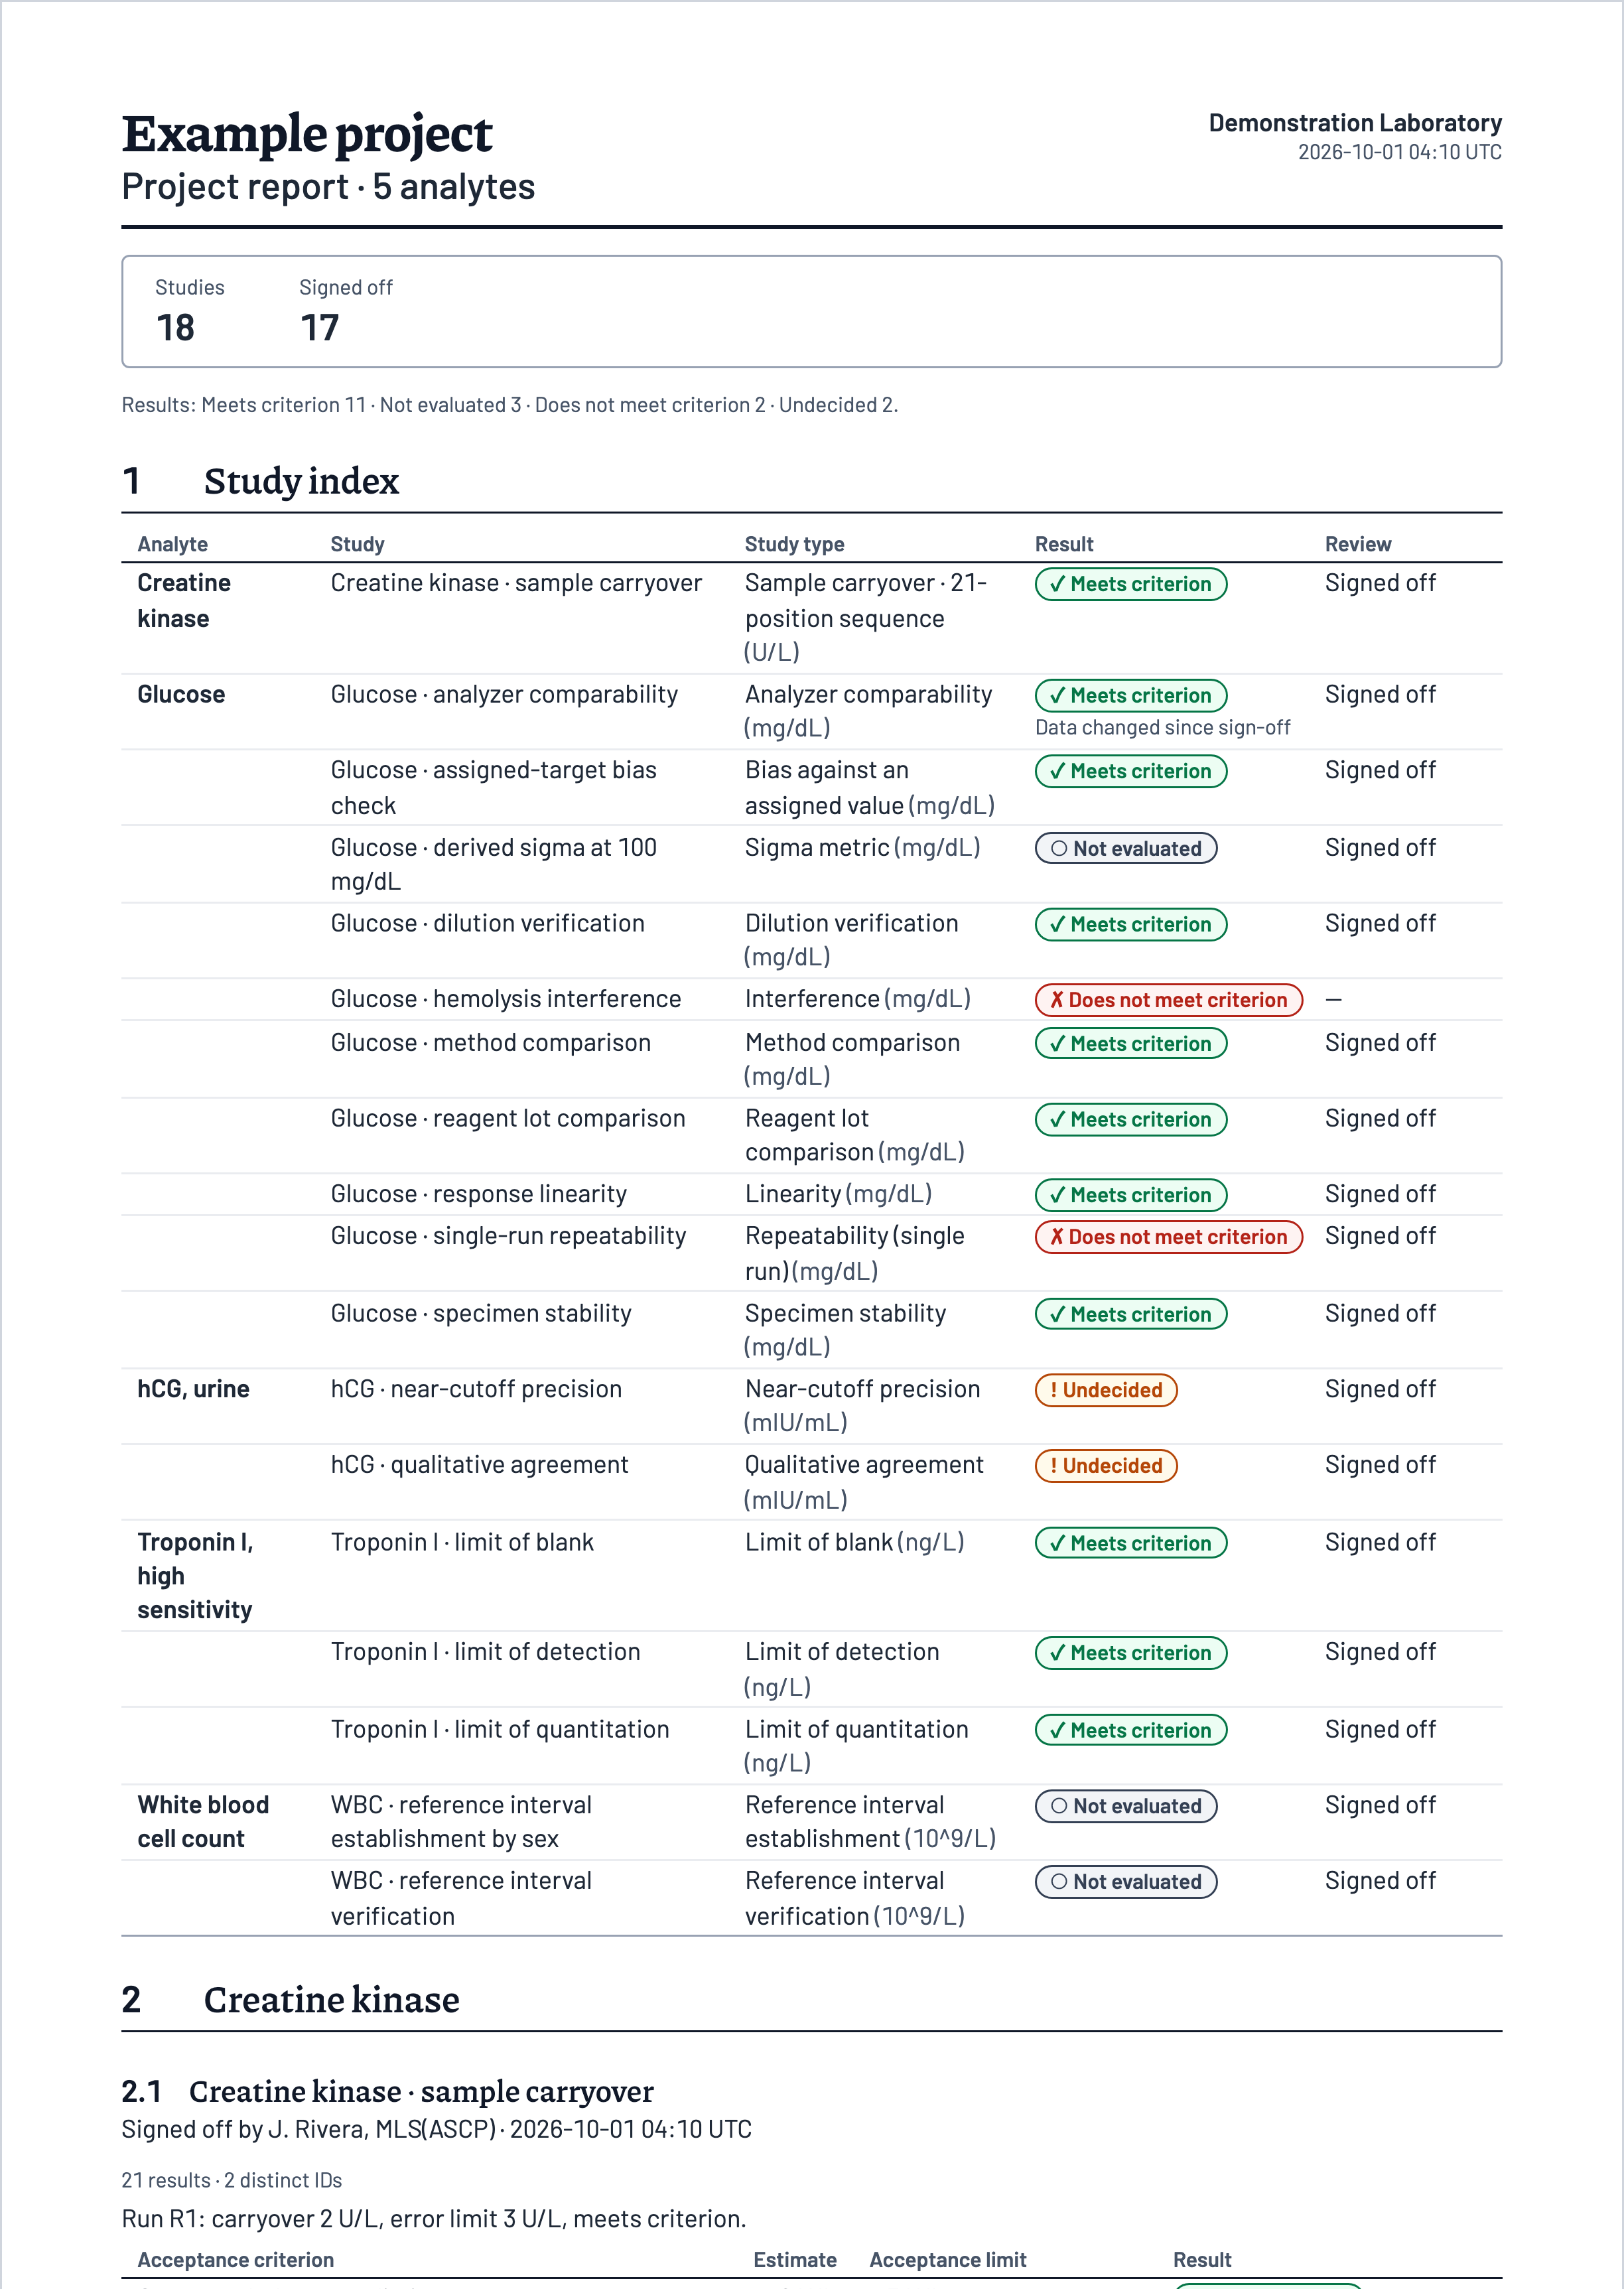
Page 1 of a project report: 18 studies, 17 signed off; the repeatability and hemolysis interference studies do not meet their criteria.

From raw result to defensible record

Keep related studies together. A project report brings their outcomes into one record.

Limits set up front
Acceptance criteria are set before you calculate. Later changes are recorded on the report.
Signed means final
A signed report stays as signed. Corrections make a new version.
Nothing quietly dropped
Original values stay, and every exclusion carries its reason onto the report.
Records you can take with you
Download your workspace’s data, history and saved reports in one file.